 ar
ar bg
bg hr
hr cs
cs da
da nl
nl fi
fi fr
fr de
de el
el hi
hi it
it ko
ko no
no pl
pl pt
pt ro
ro ru
ru es
es sv
sv tl
tl iw
iw id
id lv
lv lt
lt sr
sr sk
sk sl
sl uk
uk vi
vi et
et hu
hu th
th tr
tr fa
fa ms
ms hy
hy ka
ka ur
ur bn
bn mn
mn ta
ta kk
kk uz
uz ku
ku
Daisy-Chained Digital Thermometer
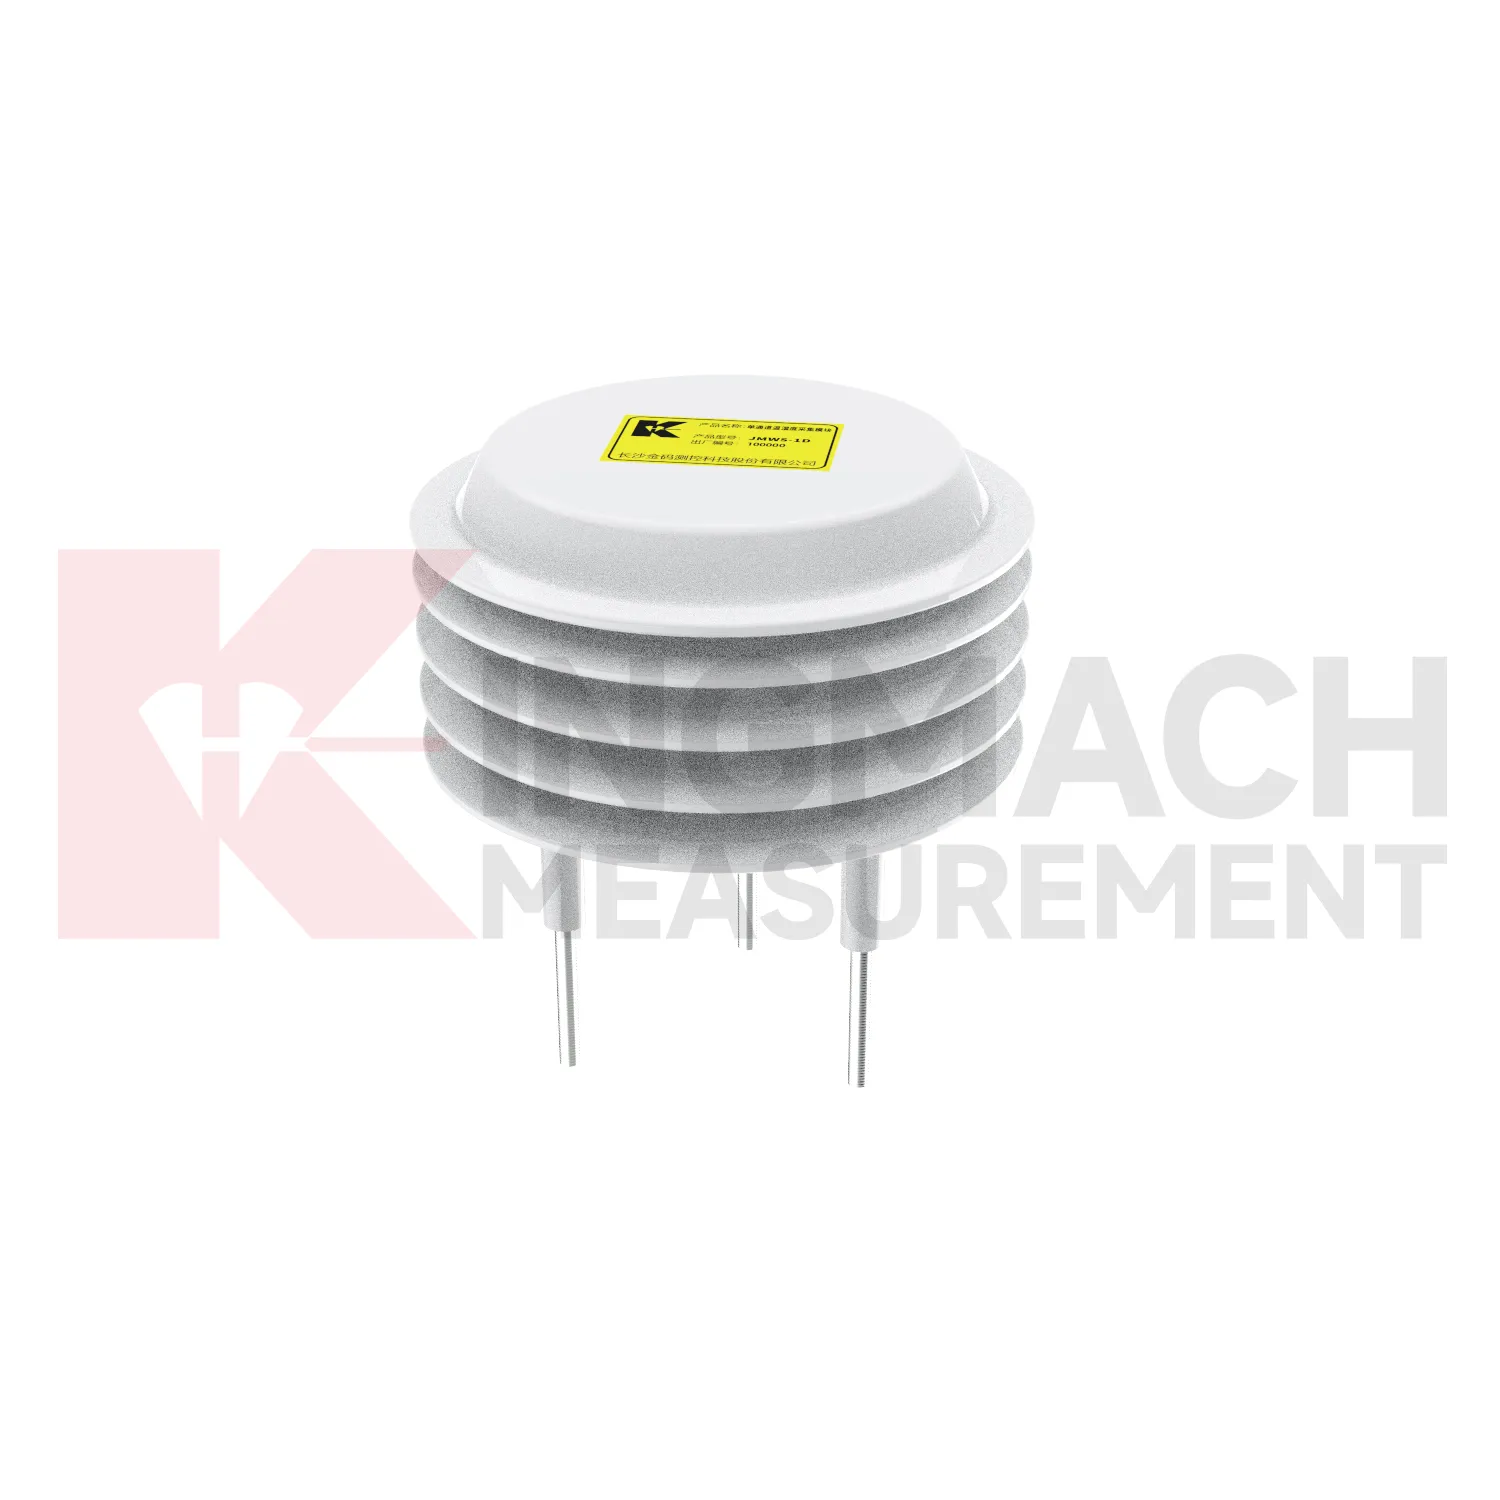
Temperature monitoring in Kingmach Daisy-Chained Digital Thermometer gives engineers a way to separate environmental effects from structural change. Many materials expand and contract with heat. Sensors, cables, cabinets, and enclosures also behave differently under temperature stress. In bridges, temperature can affect strain and displacement records. In tunnels, it can interact with humidity and ventilation. In industrial areas, it may follow equipment operation. In energy, transportation, railway, and construction settings, a stable temperature record helps reviewers avoid treating a thermal pattern as a structural defect. The monitoring point should be placed according to the question being asked: material temperature, air condition, cabinet environment, or general site exposure. Each placement tells a different story, and the report should make that difference clear.
A good review habit is to compare the condition channel with the nearest asset behavior instead of reading it as a standalone weather value. That keeps the record tied to slope movement, bridge response, tunnel equipment, dam seepage, drainage behavior, or cabinet reliability.
The installation file should explain why the location represents the monitored area. If the point is sheltered, shaded, exposed, buried, elevated, or placed inside an enclosure, that fact changes how later readings should be understood by maintenance staff.
During abnormal events, the first question is not only whether the value crossed a limit. The reviewer should ask what changed around the site, whether the related structure reacted, and whether a field inspection confirmed the same pattern.


Application of Daisy-Chained Digital Thermometer
Agriculture and irrigation projects use Kingmach Daisy-Chained Digital Thermometer to understand the relation between rainfall, irrigation, soil wetness, air conditions, and plant or ground response. The purpose is not just to display weather information. The record should help managers decide when soil is drying, whether irrigation reached the intended depth, whether rainfall replaced a scheduled watering event, and how greenhouse or field conditions changed over time. Probe depth, soil type, crop zone, irrigation schedule, and cable route should be recorded at installation. Air temperature and humidity can be reviewed with soil wetness to understand drying speed and growing conditions. A consistent environmental record supports practical water management and helps avoid decisions based only on surface appearance.
Maintenance teams should record cleaning, access difficulty, enclosure condition, cable repair, vegetation growth, nearby equipment changes, and the first normal reading after work. Those notes protect the meaning of the curve when old data is reviewed months later.
The environmental point should be part of a named monitoring question. It may explain wetting, drying, wind exposure, thermal movement, cabinet stress, or pressure variation, but that purpose needs to be visible in drawings and reports.
If the reading seems unusual, the team should check the physical condition of the station before drawing conclusions about the asset. Blockage, poor exposure, loose wiring, water entry, and changed surroundings can all create misleading patterns.
The future of Daisy-Chained Digital Thermometer
Remote station health will become more important for Kingmach Daisy-Chained Digital Thermometer. Environmental points are often placed on slopes, bridges, dams, towers, construction sites, and irrigation areas where access is inconvenient. A future-ready station should report whether it is powered, communicating, collecting plausible values, and recently maintained. Missing data during a storm can be more serious than missing data during calm weather. Maintenance teams need to know whether a silence means quiet conditions, power trouble, blocked equipment, or communication loss. Better station-health reporting will help owners trust environmental data during the events that matter most.
Maintenance teams should record cleaning, access difficulty, enclosure condition, cable repair, vegetation growth, nearby equipment changes, and the first normal reading after work. Those notes protect the meaning of the curve when old data is reviewed months later.
The environmental point should be part of a named monitoring question. It may explain wetting, drying, wind exposure, thermal movement, cabinet stress, or pressure variation, but that purpose needs to be visible in drawings and reports.
Care & Maintenance of Daisy-Chained Digital Thermometer
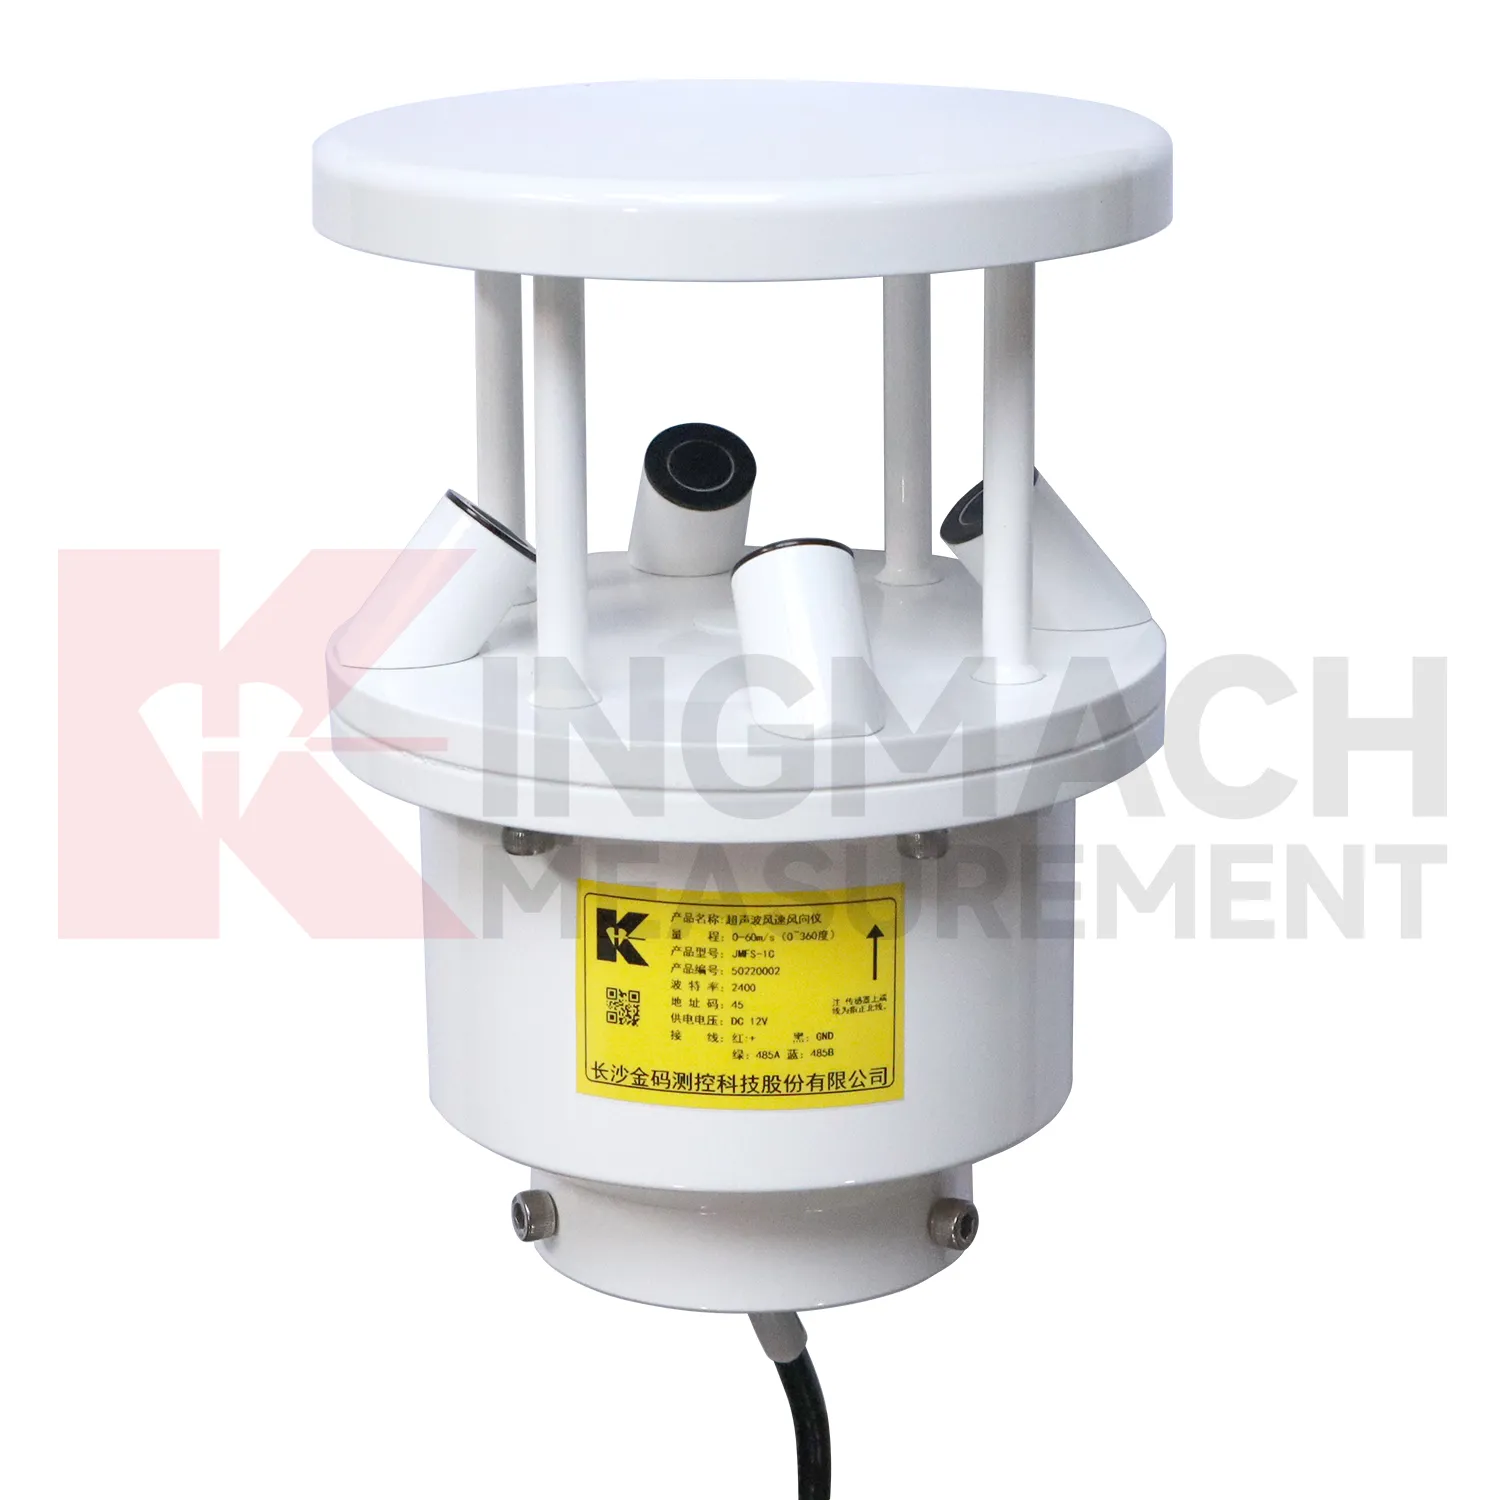
Wind-station maintenance for Kingmach Daisy-Chained Digital Thermometer should preserve exposure and mounting stability. Check for new obstructions, loose poles, tilted brackets, damaged connectors, lightning effects, corrosion, ice, salt, dust, and cable strain. The wind point should represent the monitored bridge, tower, airport area, marine site, tunnel portal, or construction zone. If a nearby structure, scaffold, crane, or temporary cover changes airflow, the record may no longer explain the asset. Maintenance notes should state what was inspected, what was cleaned, and whether the first readings after work looked normal. Reliable wind data depends on both instrument condition and a clear flow path.
A good review habit is to compare the condition channel with the nearest asset behavior instead of reading it as a standalone weather value. That keeps the record tied to slope movement, bridge response, tunnel equipment, dam seepage, drainage behavior, or cabinet reliability.
The installation file should explain why the location represents the monitored area. If the point is sheltered, shaded, exposed, buried, elevated, or placed inside an enclosure, that fact changes how later readings should be understood by maintenance staff.
Kingmach Daisy-Chained Digital Thermometer
A Kingmach Daisy-Chained Digital Thermometer station should be planned as a small field system. The rain point needs open exposure and level installation. The wind point needs representative airflow rather than shelter behind a wall. A soil probe needs firm contact at a meaningful depth. A humidity point needs to represent the room, tunnel, cabinet, or work zone being monitored. Power, cables, connectors, enclosure protection, and communication channels matter because poor field setup can create misleading records. The station drawing should show where each condition is measured and why that position was chosen. This makes later review easier when the site changes, a cabinet is moved, or a reading no longer matches surrounding conditions.
Long-term value comes from consistency. A channel that keeps the same location, unit, maintenance history, and linked asset record can support seasonal comparison, post-storm review, and handover between construction and operation teams.
Maintenance teams should record cleaning, access difficulty, enclosure condition, cable repair, vegetation growth, nearby equipment changes, and the first normal reading after work. Those notes protect the meaning of the curve when old data is reviewed months later.
FAQ
Q: What does Kingmach Daisy-Chained Digital Thermometer measure?
A: It measures site conditions such as rainfall, wind, temperature, humidity, pressure, and soil wetness so engineers can compare the environment with structural or ground behavior.
Q: Why is this data important?
A: Environmental conditions often explain why deformation, vibration, seepage, cabinet faults, or strain changes occur at a particular time.
Q: Should these records be reviewed alone?
A: No. They are most useful when placed beside settlement, displacement, tilt, load, strain, vibration, inspection notes, and maintenance records.
Q: How should a station be planned?
A: Start with the engineering risk, then decide which condition must be measured, where it should be measured, and which structural record it supports.
Q: What makes a good environmental record?
A: Clear location, correct units, stable placement, protected hardware, time alignment, and visible maintenance notes make the record useful over time.
During abnormal events, the first question is not only whether the value crossed a limit. The reviewer should ask what changed around the site, whether the related structure reacted, and whether a field inspection confirmed the same pattern.
Reviews
Daniel Brown
Excellent environmental monitoring sensors. The data is consistent, and the system integrates smoothly with our existing setup.
David Wilson
We purchased displacement transducers and settlement sensors, and the quality exceeded our expectations. Easy installation and reliable performance.
Latest Inquiries
To protect the privacy of our buyers, only public service email domains like Gmail, Yahoo, and MSN will be displayed. Additionally, only a limited portion of the inquiry content will be shown.
Charlotte***@gmail.comUnited Arab Emirates
Hi, we require instrumentation cables suitable for harsh environments. Could you advise on specifica...
Sophia***@gmail.comUnited Kingdom
Good day, we need environmental monitoring sensors including temperature, humidity, and wind sensors...
Related product categories
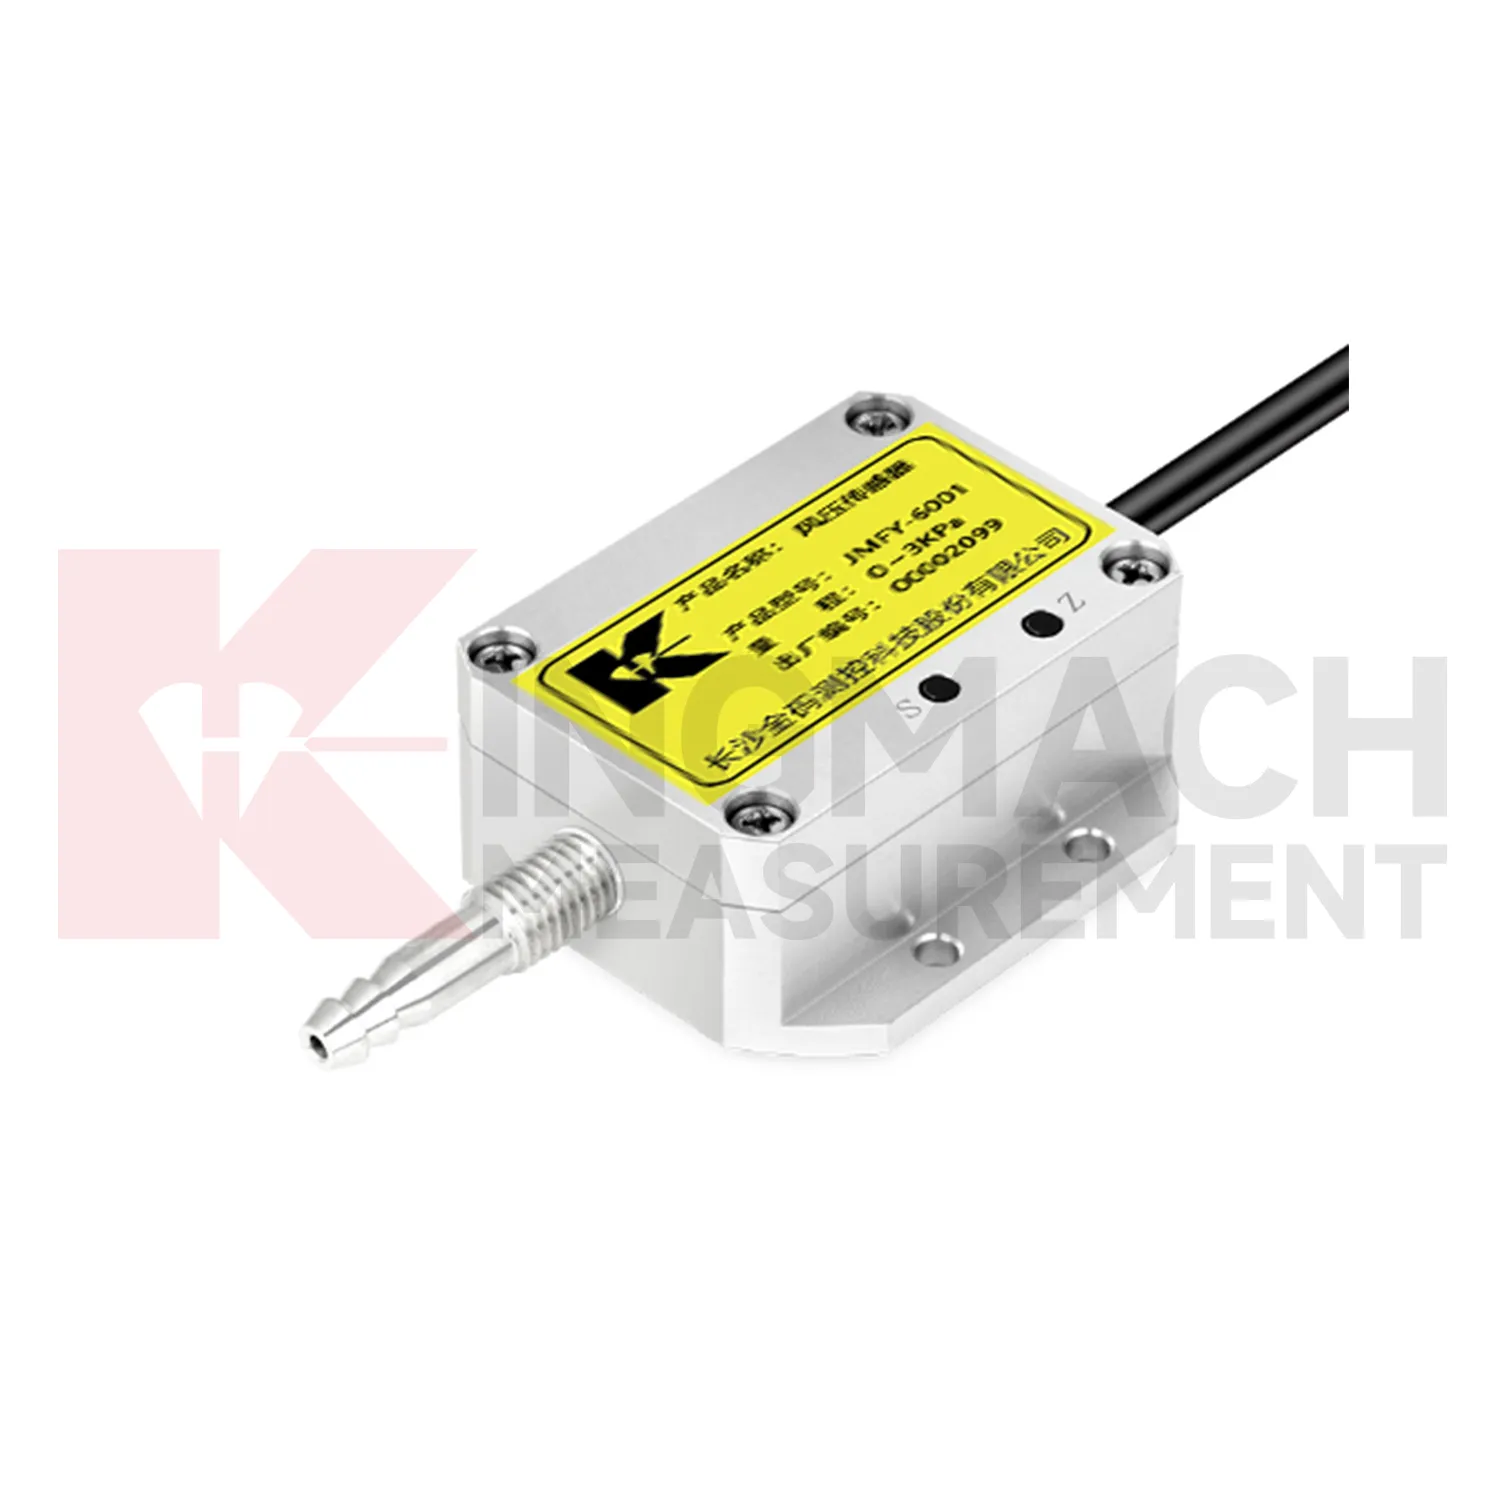
- wind pressure sensor
- ultrasonic wind speed and direction sensor
- wind speed and direction sensor
- wind speed and wind direction sensor
- wind speed and direct sensor
- wireless wind speed and direction sensor
- wind direction and speed sensor
- wind speed and direction sensors
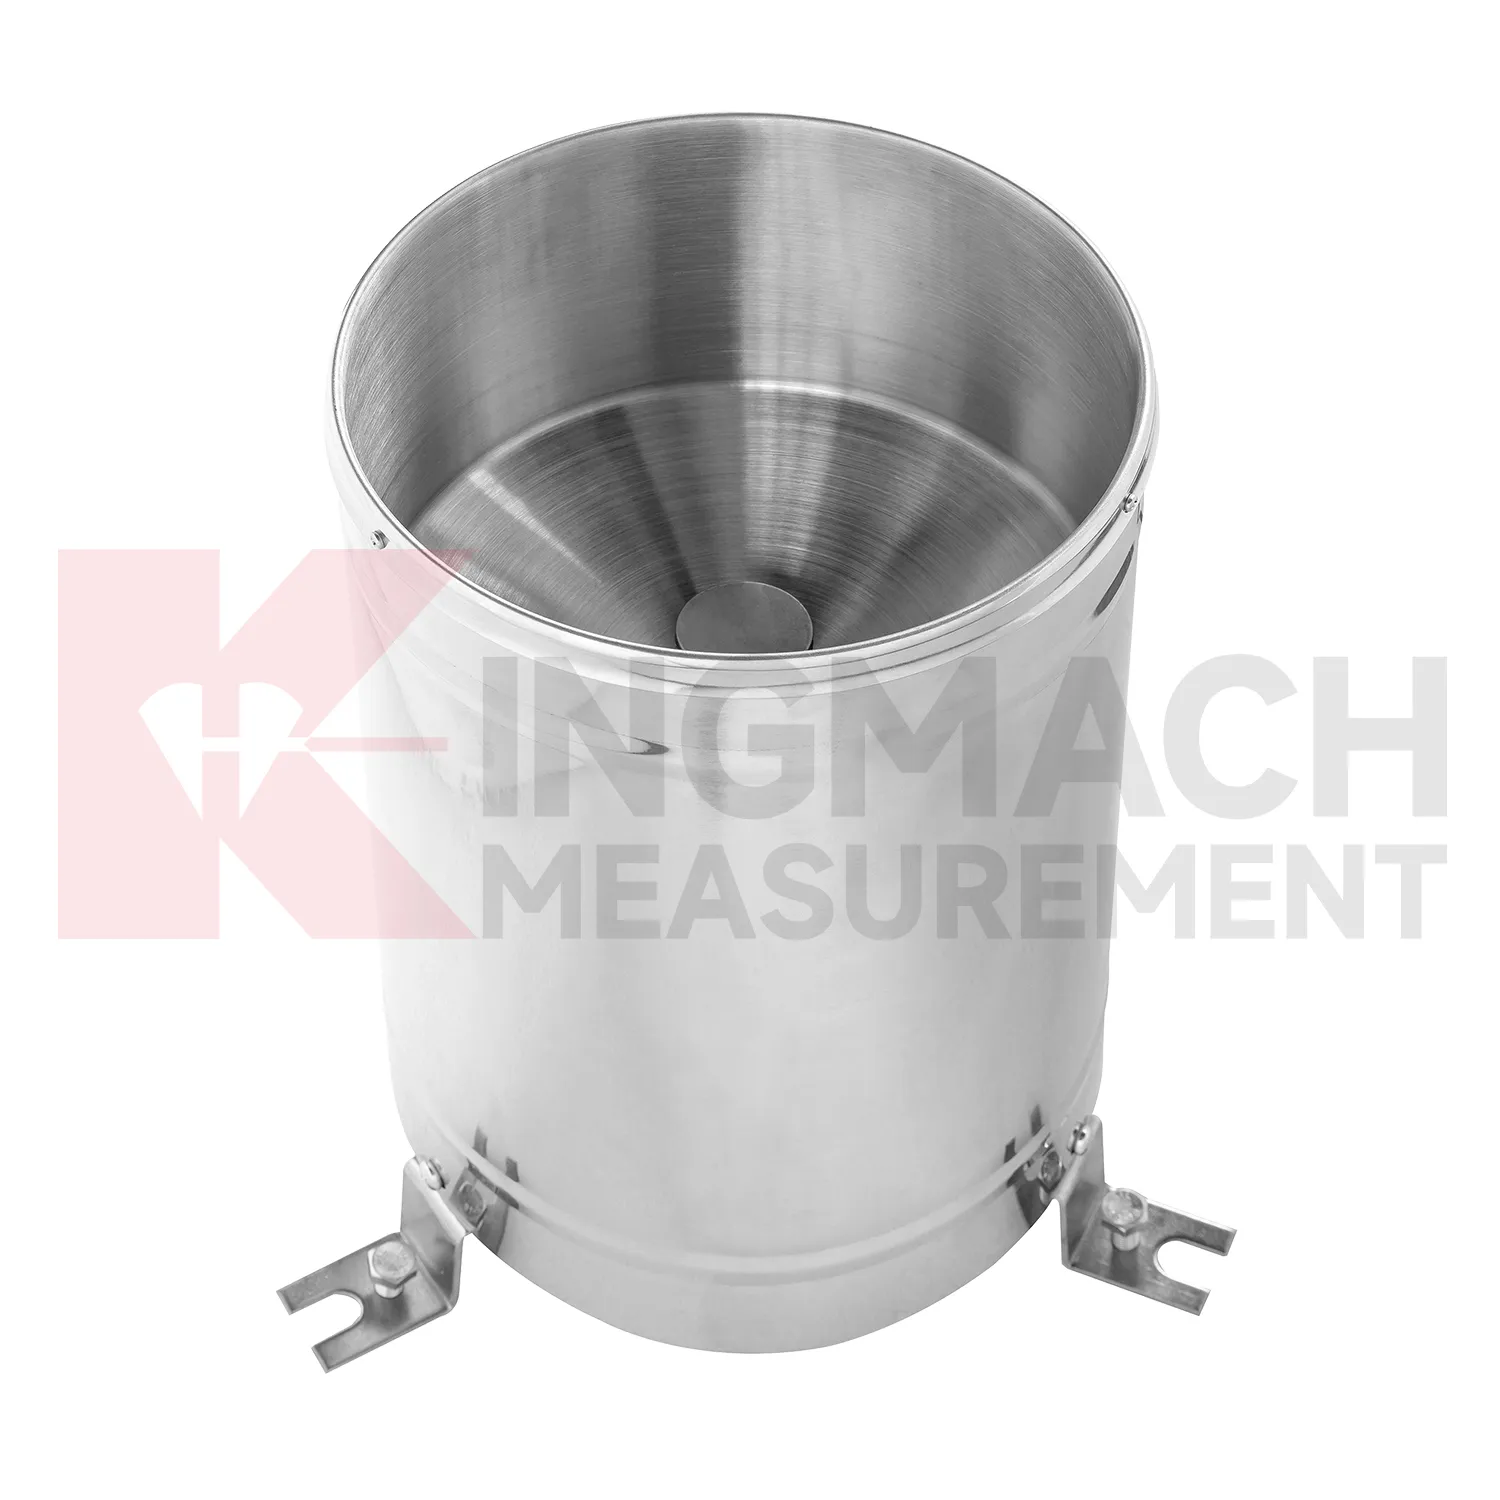
- tipping bucket rain gauge
- tipping bucket rain gauge resolution 0.2 mm standard
- tipping bucket rain gauges
- tipping bucket rain gauge resolution 0.1 mm 0.2 mm standard