 ar
ar bg
bg hr
hr cs
cs da
da nl
nl fi
fi fr
fr de
de el
el hi
hi it
it ko
ko no
no pl
pl pt
pt ro
ro ru
ru es
es sv
sv tl
tl iw
iw id
id lv
lv lt
lt sr
sr sk
sk sl
sl uk
uk vi
vi et
et hu
hu th
th tr
tr fa
fa ms
ms hy
hy ka
ka ur
ur bn
bn mn
mn ta
ta kk
kk uz
uz ku
ku
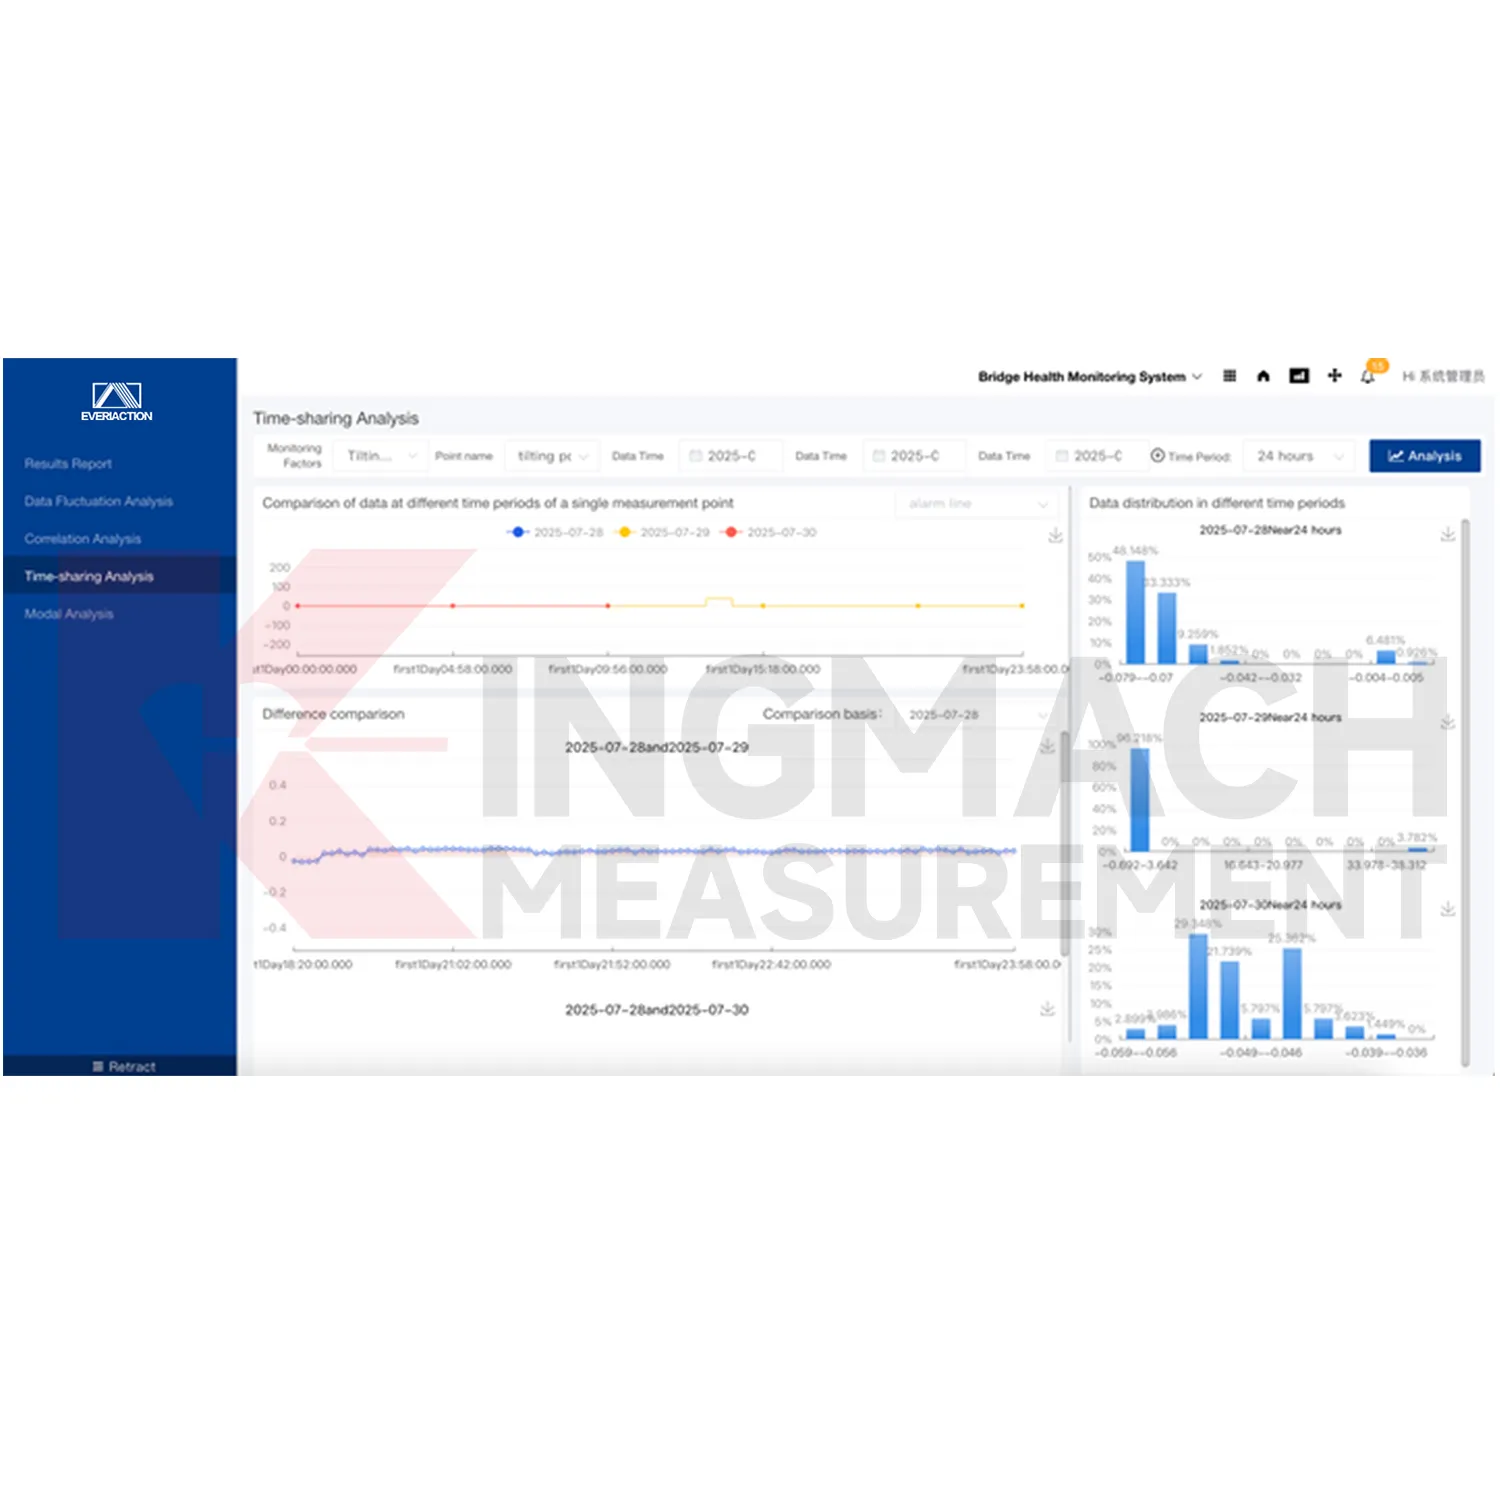
Visualization Software
The Monitoring system software platform can build structural safety models and support intelligent detection and health analysis. The local product file describes the use of formulas, algorithms, and manual research and judgment methods to determine the location and extent of structural damage. This makes the platform useful when monitoring data must support engineering interpretation instead of simple storage. The software can warn of changes in structural performance and help reviewers connect abnormal readings with a specific asset area, sensor group, or inspection record.
Application of Visualization Software
Foundation pit monitoring uses Kingmach Visualization Software to coordinate support force, displacement, settlement, groundwater, tilt, and environmental records during construction. Pit sites change quickly, and data must be reviewed alongside excavation stage, support installation, rainfall, pumping, and nearby building response. Flexible alarm rules help the team distinguish routine stage-related movement from a reading that needs inspection. Project documents and dynamic information also help later reviewers understand what was happening when a trend changed.
The future of Visualization Software
Digital twin projects will use Kingmach Visualization Software as the live data layer behind structural models. A twin needs current readings, historical trends, device identity, alarm status, and inspection records to stay meaningful. The platform can help feed that model with organized monitoring data from many instrument types. When a bridge, tunnel, dam, building, or slope changes, the twin can be updated with both sensor evidence and field notes, making the virtual record closer to the real asset condition.
Care & Maintenance of Visualization Software
Data quality checks should be routine in Kingmach Visualization Software. Look for missing values, frozen channels, impossible jumps, timestamp errors, unit mismatch, repeated noise, or disagreement between related sensors. A platform can display data quickly, but engineering trust depends on the quality of the incoming records. When a problem appears, check the field device, cable, communication path, acquisition module, and recent configuration changes before treating the reading as structural behavior.
Kingmach Visualization Software
Kingmach Visualization Software makes reporting easier because monitoring evidence is already organized by project, device, channel, trend, alarm, and document. Registered experts can issue professional result reports through the platform workflow described in the local product file. For owners, reports need to explain what changed, where it happened, which instruments confirmed it, and what field action followed. A platform that stores data, filters records, generates visual trends, and keeps project documents together makes that reporting process more traceable than manual consolidation after the event.
FAQ
Q: What certification is listed?
A: The product information lists GB50982-2014 certification.
Q: What is the minimum order quantity?
A: The local product page lists one piece as the minimum order quantity.
Q: What is the delivery time?
A: Delivery time is listed as instant for the software platform.
Q: How is pricing handled?
A: Pricing is listed as negotiable, so project scope, configuration, and integration needs should be confirmed with Kingmach.
Q: What payment term is shown?
A: The local product page lists T/T in advance.
Reviews
Robert Taylor
The weir flow meter is well-built and delivers accurate measurements. Great value for water management applications.
Matthew Garcia
Instrumentation cables are durable and perform well even in harsh environments. Will definitely order again.
Latest Inquiries
To protect the privacy of our buyers, only public service email domains like Gmail, Yahoo, and MSN will be displayed. Additionally, only a limited portion of the inquiry content will be shown.
Charlotte***@gmail.comUnited Arab Emirates
Hi, we require instrumentation cables suitable for harsh environments. Could you advise on specifica...
Ava***@gmail.comAustralia
Hi, I am looking for reliable tiltmeters and accelerometers for structural health monitoring. Please...
Related product categories
- Monitoring Software Suite
- Monitoring system software platform
- Environmental Monitoring
- Visualization Software
- GPS Displacement Monitoring System
- Integrated Monitoring Station
- Settlement Monitoring Rod
- Structural Health Monitoring (SHM) System
- Structural Monitoring Cloud Platform
- IoT Online Monitoring System
- Monitoring System Platform & Services
- Engineering Pulse Intelligent Monitoring Cloud Platform