 ar
ar bg
bg hr
hr cs
cs da
da nl
nl fi
fi fr
fr de
de el
el hi
hi it
it ko
ko no
no pl
pl pt
pt ro
ro ru
ru es
es sv
sv tl
tl iw
iw id
id lv
lv lt
lt sr
sr sk
sk sl
sl uk
uk vi
vi et
et hu
hu th
th tr
tr fa
fa ms
ms hy
hy ka
ka ur
ur bn
bn mn
mn ta
ta kk
kk uz
uz ku
ku
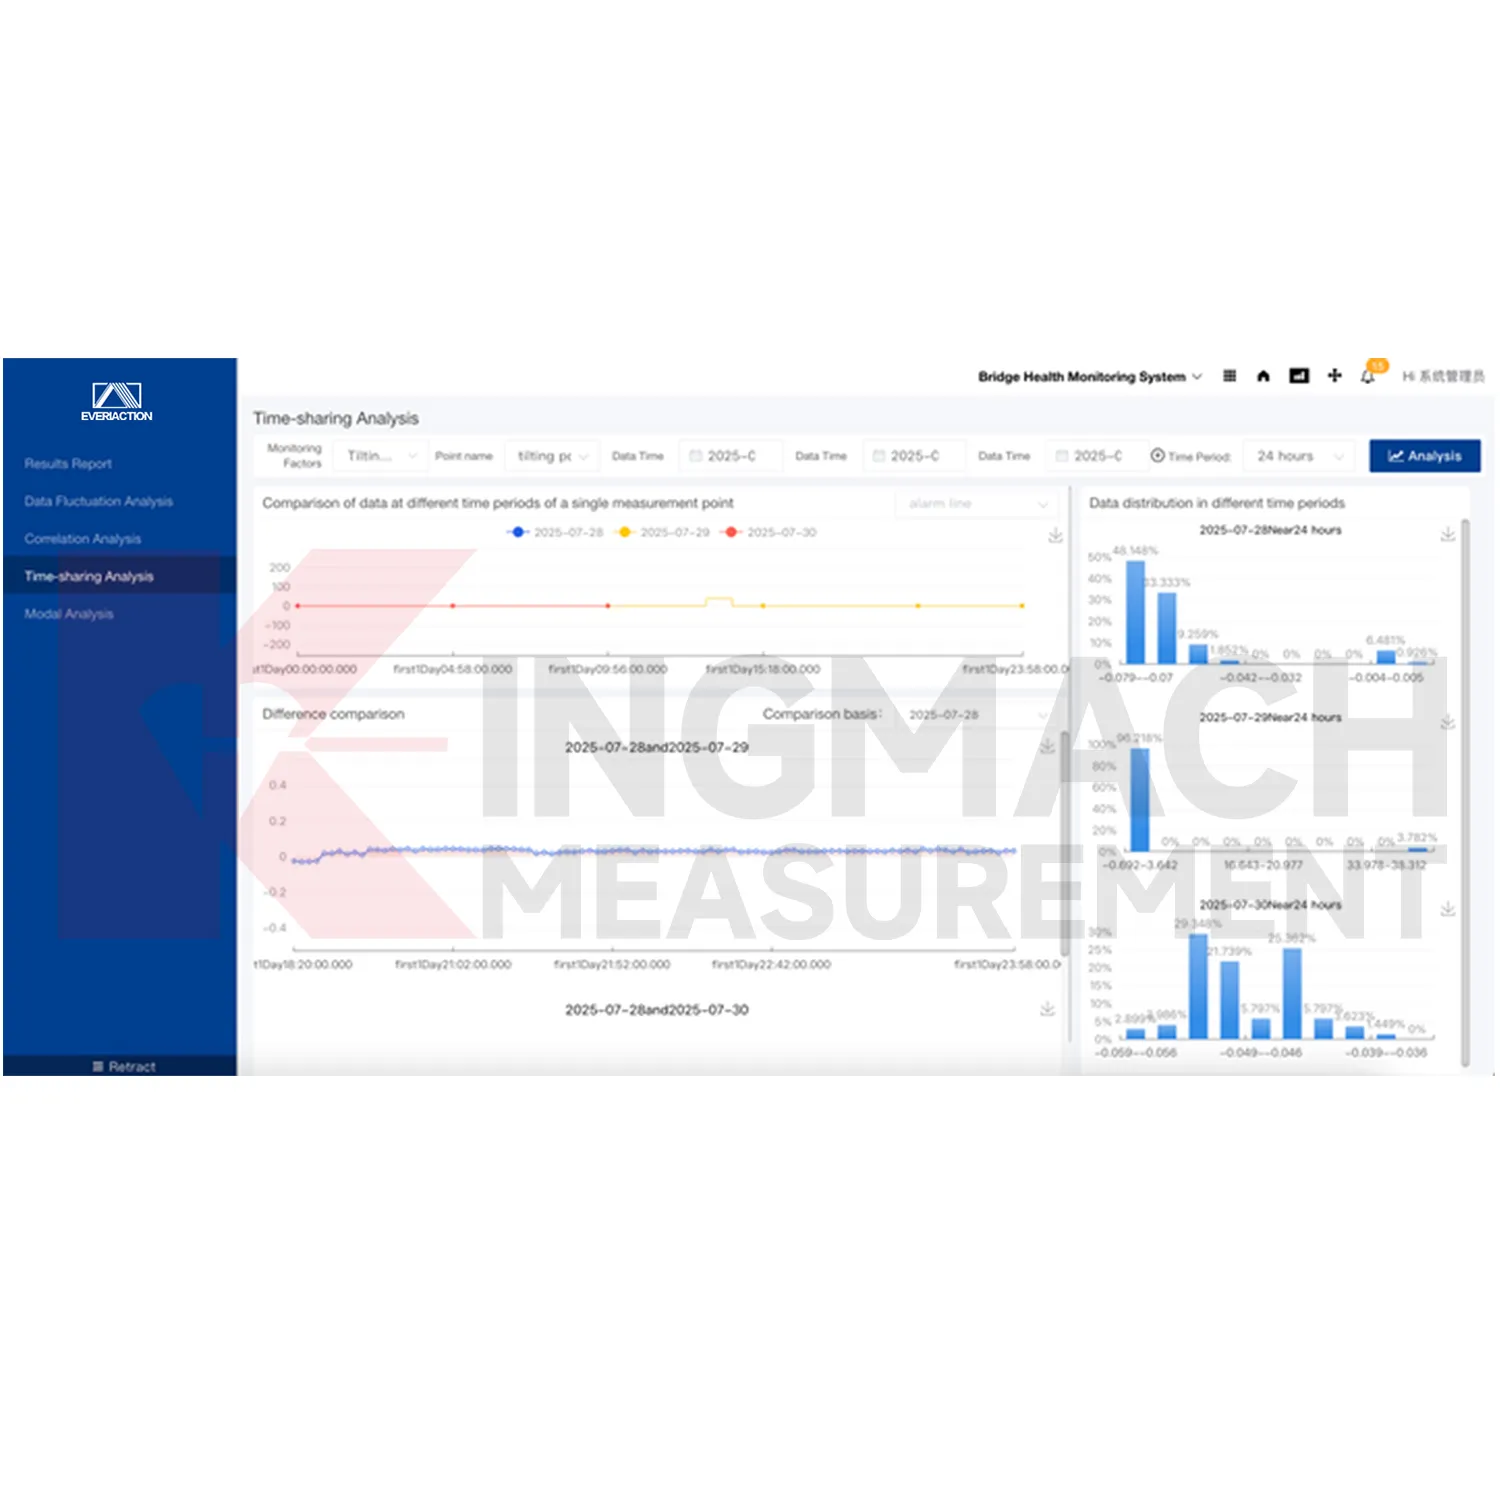
Web-based Monitoring Software
The Monitoring system software platform can build structural safety models and support intelligent detection and health analysis. The local product file describes the use of formulas, algorithms, and manual research and judgment methods to determine the location and extent of structural damage. This makes the platform useful when monitoring data must support engineering interpretation instead of simple storage. The software can warn of changes in structural performance and help reviewers connect abnormal readings with a specific asset area, sensor group, or inspection record.
Application of Web-based Monitoring Software
Bridge monitoring uses Kingmach Web-based Monitoring Software to bring strain, displacement, cable force, vibration, temperature, wind, load, and inspection records into one project environment. Bridges often have many monitoring points spread across decks, cables, pylons, bearings, and foundations. The software helps users see trend changes, alarm records, and related channels without moving between separate device files. When traffic, wind, impact, or maintenance work affects the structure, the platform can preserve event context and support clearer engineering review.
The future of Web-based Monitoring Software
Standardized project records will shape the future of Kingmach Web-based Monitoring Software. Infrastructure owners increasingly need monitoring data that can survive staff changes, contractor changes, upgrades, and long asset lifetimes. A project-based platform can keep baseline data, device information, inspection notes, alarm levels, and documents in a consistent structure. That record becomes useful years later when teams compare new behavior with earlier conditions and decide whether maintenance or deeper investigation is required.
Care & Maintenance of Web-based Monitoring Software
Alarm rules in Kingmach Web-based Monitoring Software should be reviewed by engineering staff, not copied blindly across every point. Different structures, sensors, and risk levels need different alarm logic. A settlement point, strain point, water-level point, and tilt point may require different thresholds, rate checks, and response procedures. After the first operating period, review alarm history and adjust rules where ordinary behavior is creating unnecessary alerts or where a critical pattern needs faster attention.
Kingmach Web-based Monitoring Software
Kingmach Web-based Monitoring Software turns scattered field readings into a project view that engineers, owners, and maintenance teams can actually use. A monitoring site may include strain gauges, load cells, displacement meters, settlement sensors, tiltmeters, water-level instruments, environmental sensors, accelerometers, acquisition modules, and data loggers. Without a central platform, each channel can become a separate file or screen. The Monitoring system software platform receives and stores multi-dimensional monitoring data in real time, then presents trends, alarms, reports, and project records in a clearer form. This helps users understand the status of bridges, tunnels, slopes, buildings, dams, subgrades, and foundation pits before small changes become difficult to trace.
FAQ
Q: How are trend curves used?
A: They help compare current readings with earlier behavior so gradual movement, sudden jumps, or event response can be reviewed.
Q: What does real-time filtering help with?
A: It reduces noisy or distracting records before users study the channel history.
Q: How do alarms guide action?
A: Configured rules point users toward the affected point, severity level, time, and related follow-up record.
Q: What makes reports easier?
A: Stored trends, alarms, project files, and expert review notes can be gathered without rebuilding the evidence manually.
Q: Why is graphical display useful?
A: Graphs help users see movement direction, timing, and abnormal patterns faster than raw tables alone.
Reviews
James Thompson
The tiltmeters and accelerometers are very sensitive and provide precise data. Perfect for our structural health monitoring system.
Andrew Lee
The visualization software is intuitive and powerful. It helps us analyze monitoring data efficiently.
Latest Inquiries
To protect the privacy of our buyers, only public service email domains like Gmail, Yahoo, and MSN will be displayed. Additionally, only a limited portion of the inquiry content will be shown.
Evelyn***@gmail.comSouth Africa
Hi, we are a contractor working on tunnel construction and need settlement sensors and displacement ...
Charlotte***@gmail.comUnited Arab Emirates
Hi, we require instrumentation cables suitable for harsh environments. Could you advise on specifica...