 ar
ar bg
bg hr
hr cs
cs da
da nl
nl fi
fi fr
fr de
de el
el hi
hi it
it ko
ko no
no pl
pl pt
pt ro
ro ru
ru es
es sv
sv tl
tl iw
iw id
id lv
lv lt
lt sr
sr sk
sk sl
sl uk
uk vi
vi et
et hu
hu th
th tr
tr fa
fa ms
ms hy
hy ka
ka ur
ur bn
bn mn
mn ta
ta kk
kk uz
uz ku
ku
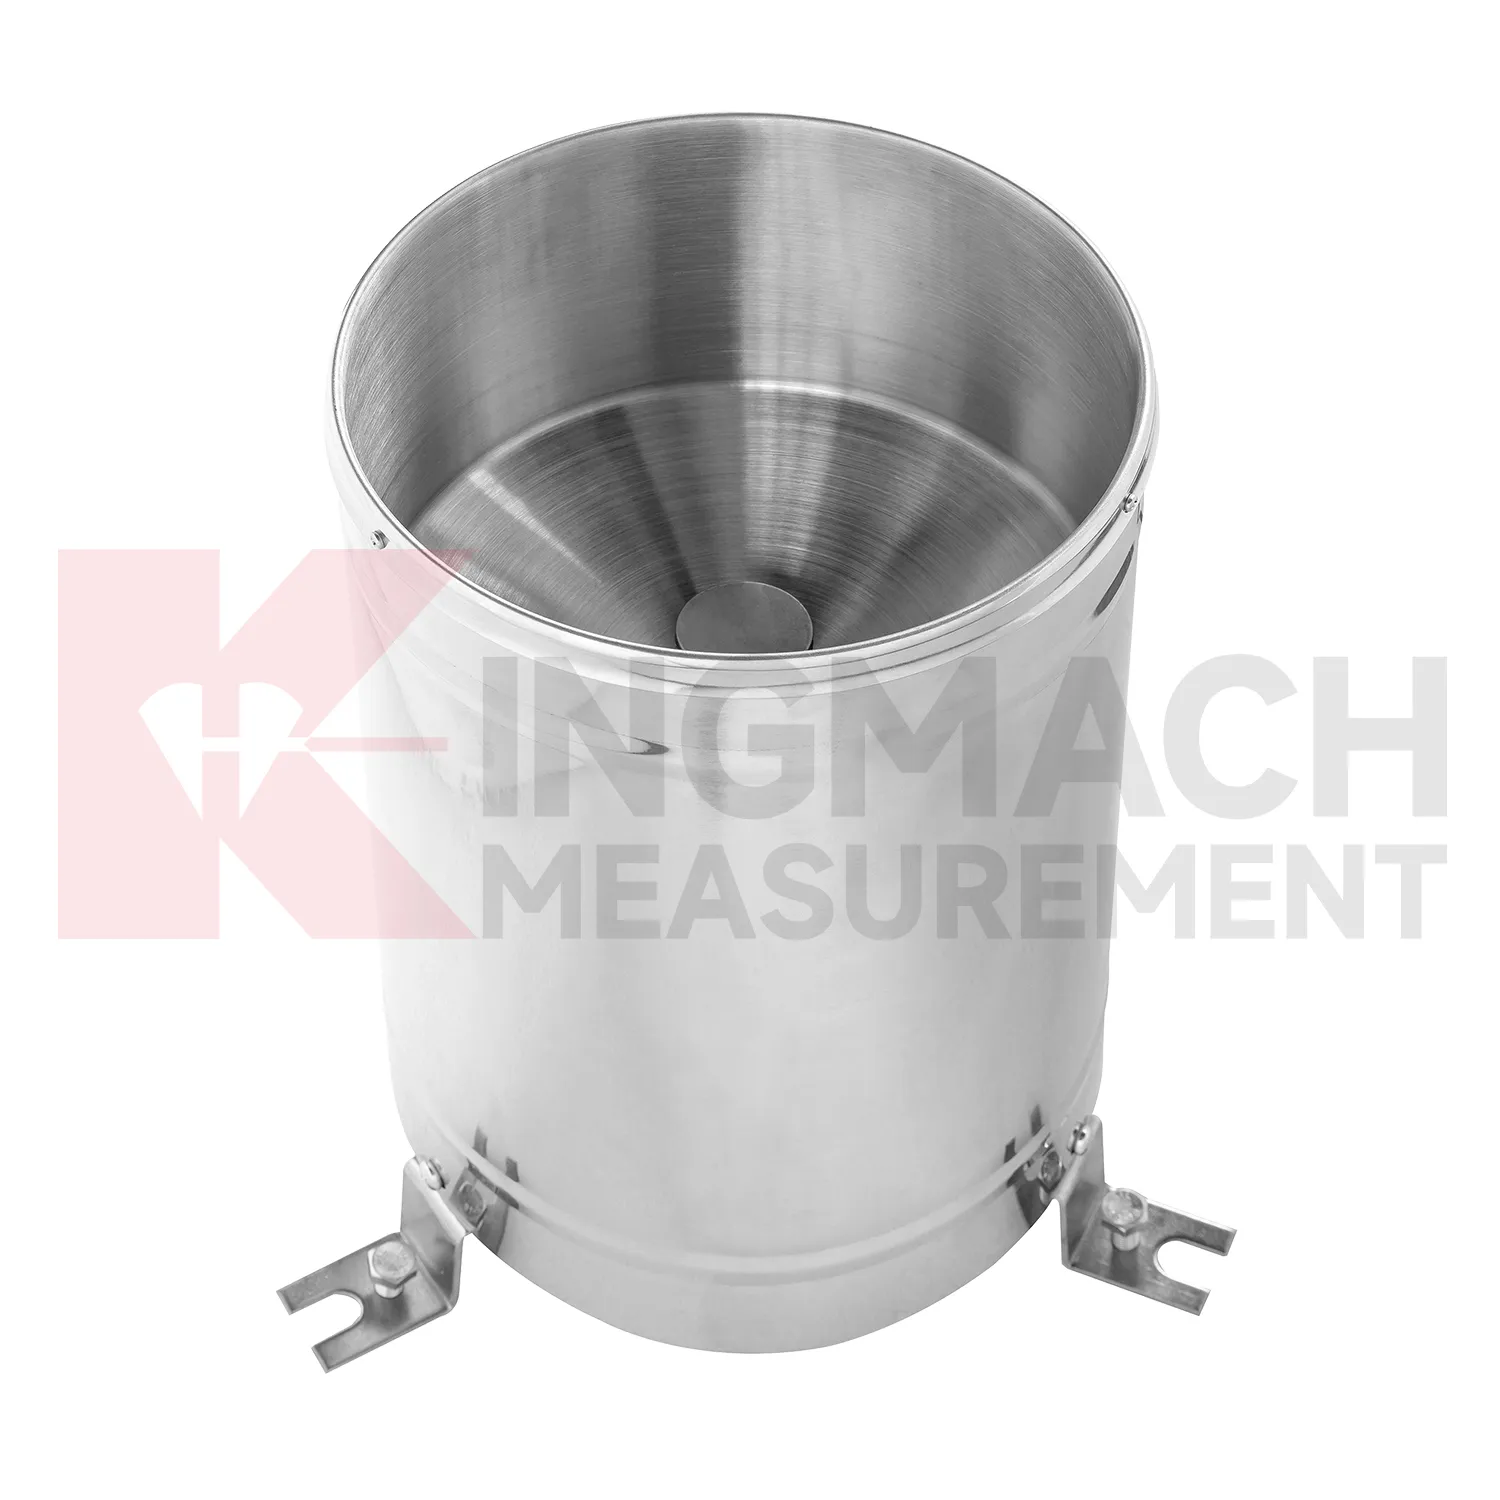
tipping rain bucket gauge
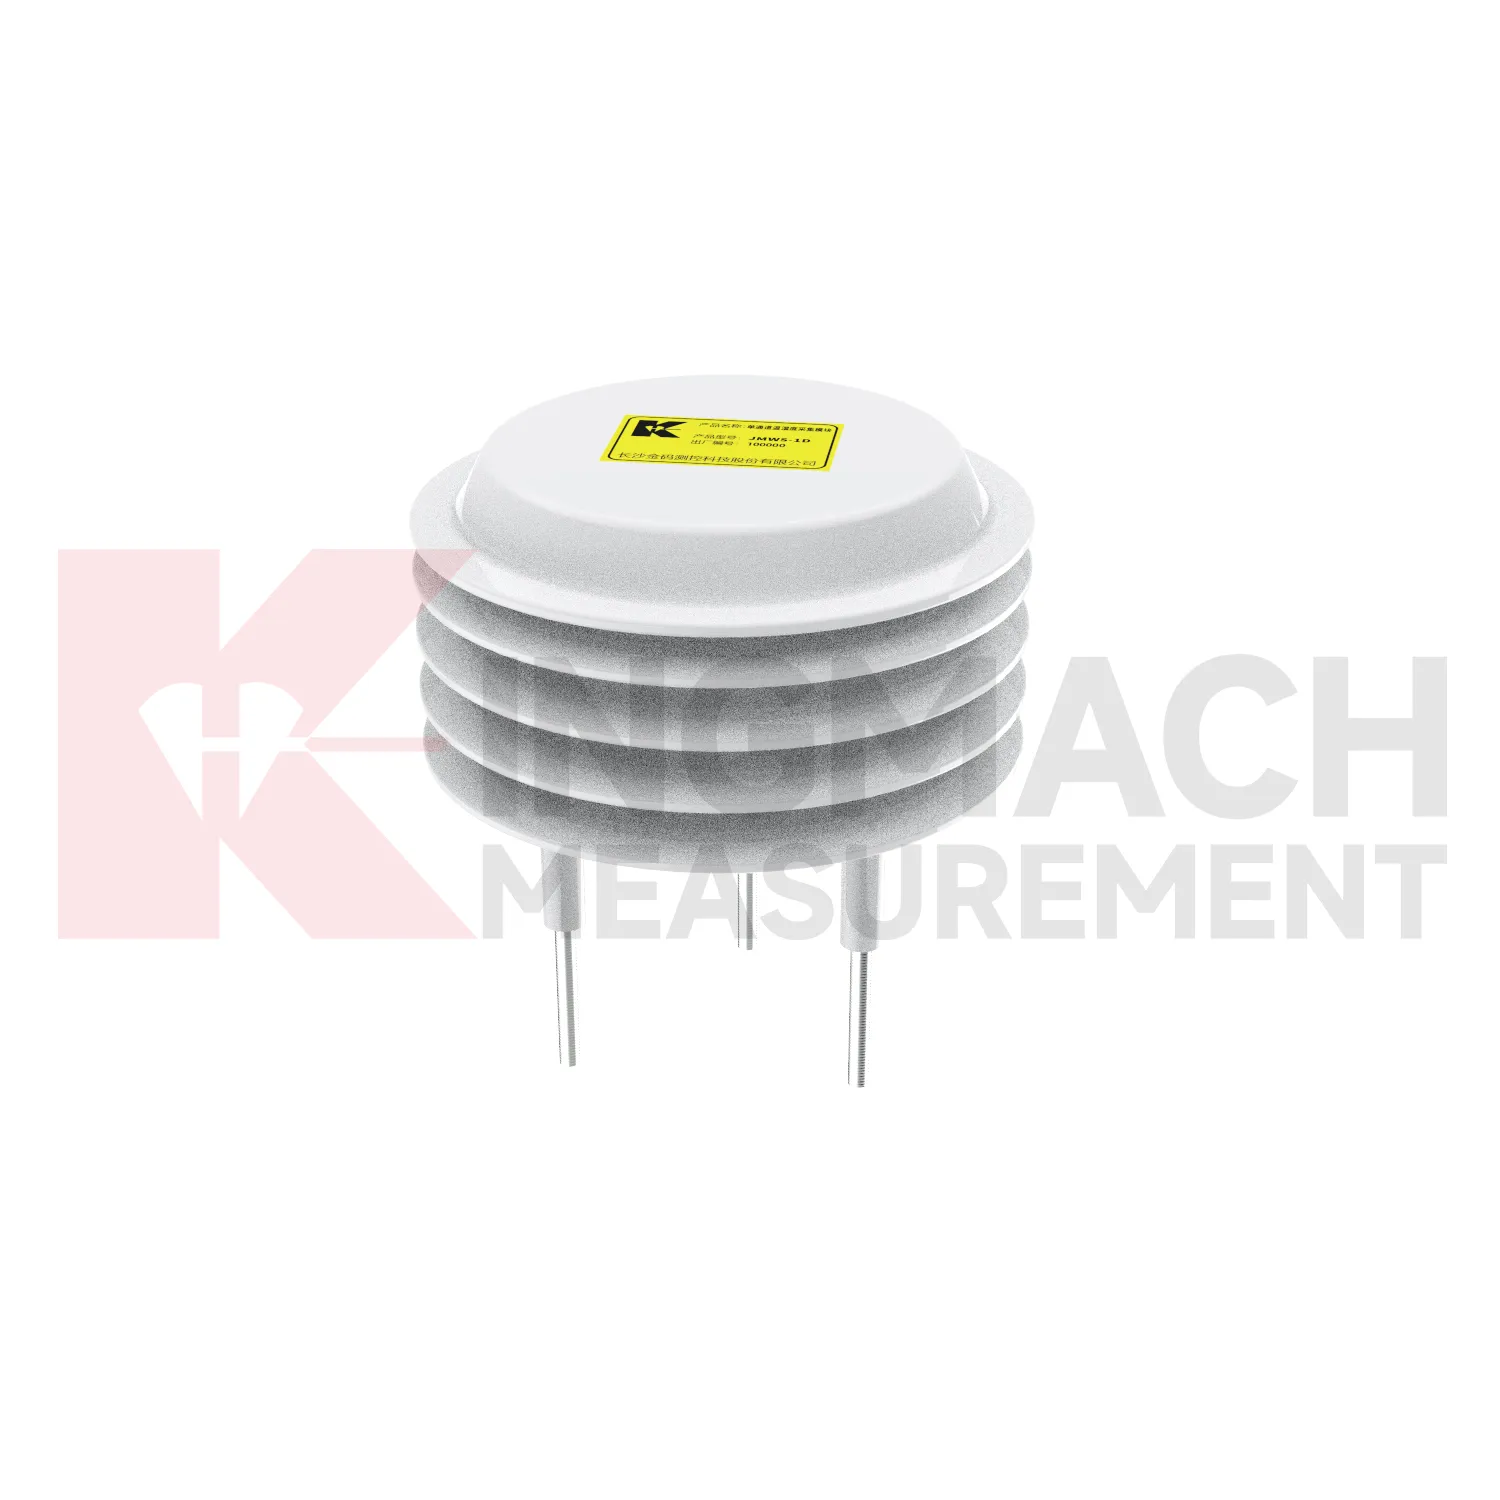
Temperature monitoring in Kingmach tipping rain bucket gauge gives engineers a way to separate environmental effects from structural change. Many materials expand and contract with heat. Sensors, cables, cabinets, and enclosures also behave differently under temperature stress. In bridges, temperature can affect strain and displacement records. In tunnels, it can interact with humidity and ventilation. In industrial areas, it may follow equipment operation. In energy, transportation, railway, and construction settings, a stable temperature record helps reviewers avoid treating a thermal pattern as a structural defect. The monitoring point should be placed according to the question being asked: material temperature, air condition, cabinet environment, or general site exposure. Each placement tells a different story, and the report should make that difference clear.
A good review habit is to compare the condition channel with the nearest asset behavior instead of reading it as a standalone weather value. That keeps the record tied to slope movement, bridge response, tunnel equipment, dam seepage, drainage behavior, or cabinet reliability.
The installation file should explain why the location represents the monitored area. If the point is sheltered, shaded, exposed, buried, elevated, or placed inside an enclosure, that fact changes how later readings should be understood by maintenance staff.
During abnormal events, the first question is not only whether the value crossed a limit. The reviewer should ask what changed around the site, whether the related structure reacted, and whether a field inspection confirmed the same pattern.
Application of tipping rain bucket gauge
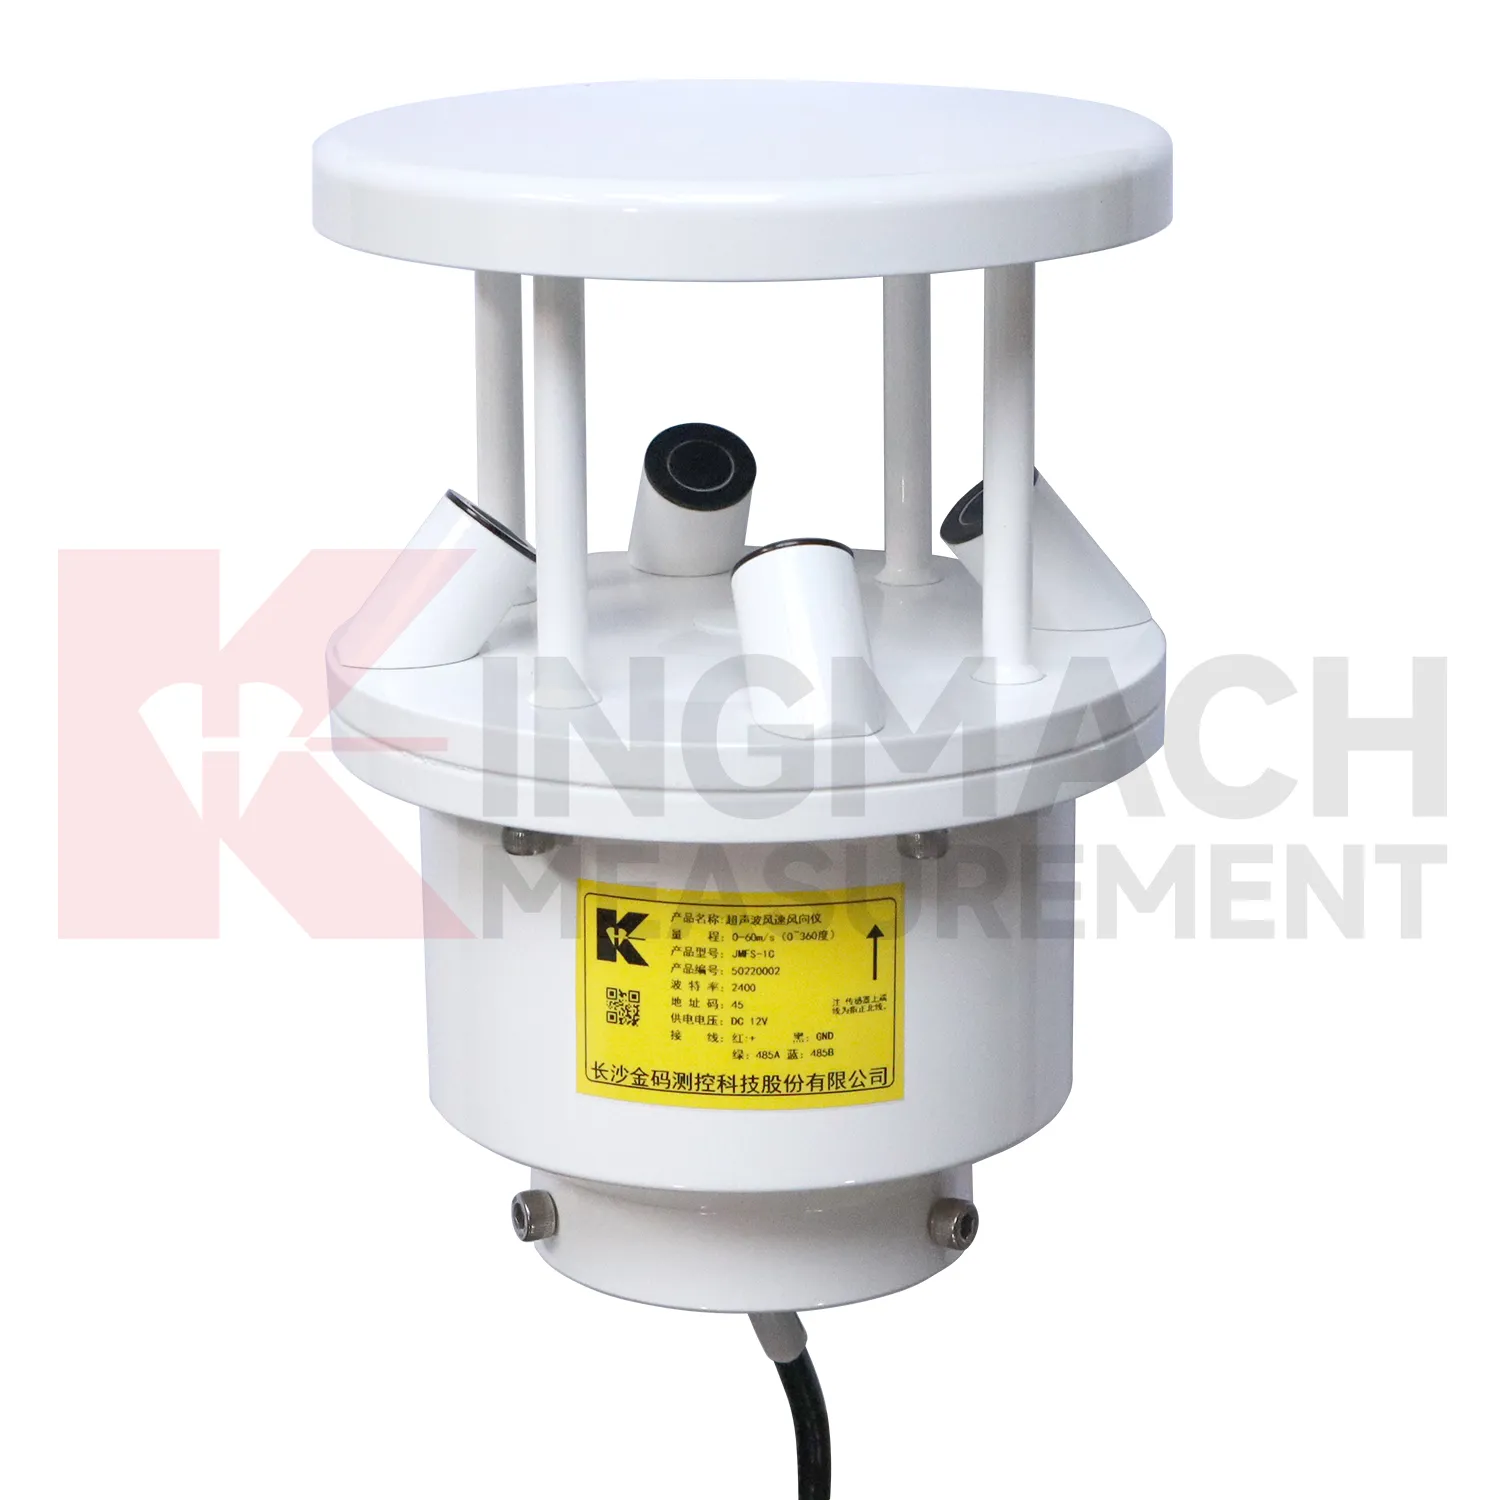
Urban environmental stations use Kingmach tipping rain bucket gauge to support infrastructure management across bridges, tunnels, public buildings, drainage areas, transport corridors, and exposed equipment sites. A station may record rain, wind, air temperature, humidity, pressure, or soil wetness depending on the risk being managed. The most important design rule is representativeness. A rain point blocked by a roof edge, a wind point sheltered by a wall, or a humidity point hidden in an unrelated cabinet can mislead users. Public infrastructure data may be reviewed by many teams, so units, point names, installation photos, and maintenance notes must be clear. A well-run station helps connect environmental change to inspections, drainage response, traffic planning, and structural monitoring.
Long-term value comes from consistency. A channel that keeps the same location, unit, maintenance history, and linked asset record can support seasonal comparison, post-storm review, and handover between construction and operation teams.
Maintenance teams should record cleaning, access difficulty, enclosure condition, cable repair, vegetation growth, nearby equipment changes, and the first normal reading after work. Those notes protect the meaning of the curve when old data is reviewed months later.
The environmental point should be part of a named monitoring question. It may explain wetting, drying, wind exposure, thermal movement, cabinet stress, or pressure variation, but that purpose needs to be visible in drawings and reports.
The future of tipping rain bucket gauge
Water-driven geotechnical review will shape future Kingmach tipping rain bucket gauge. Slopes, embankments, dams, and foundation pits often respond to rain and wetting in delayed ways. Future reports can compare rainfall timing, wetting depth, deformation rate, pore pressure, seepage, and inspection observations. This will help engineers see whether the ground only reacted briefly or remained active after the weather event. It will also support more targeted site visits because the team can identify which area had both environmental change and structural response. Environmental data will become part of geotechnical reasoning rather than a weather appendix.
If the reading seems unusual, the team should check the physical condition of the station before drawing conclusions about the asset. Blockage, poor exposure, loose wiring, water entry, and changed surroundings can all create misleading patterns.
A practical report links the condition value with time, place, and action. It should help a reviewer decide whether to keep observing, inspect the field point, compare nearby instruments, or record the event as normal site behavior.
Care & Maintenance of tipping rain bucket gauge
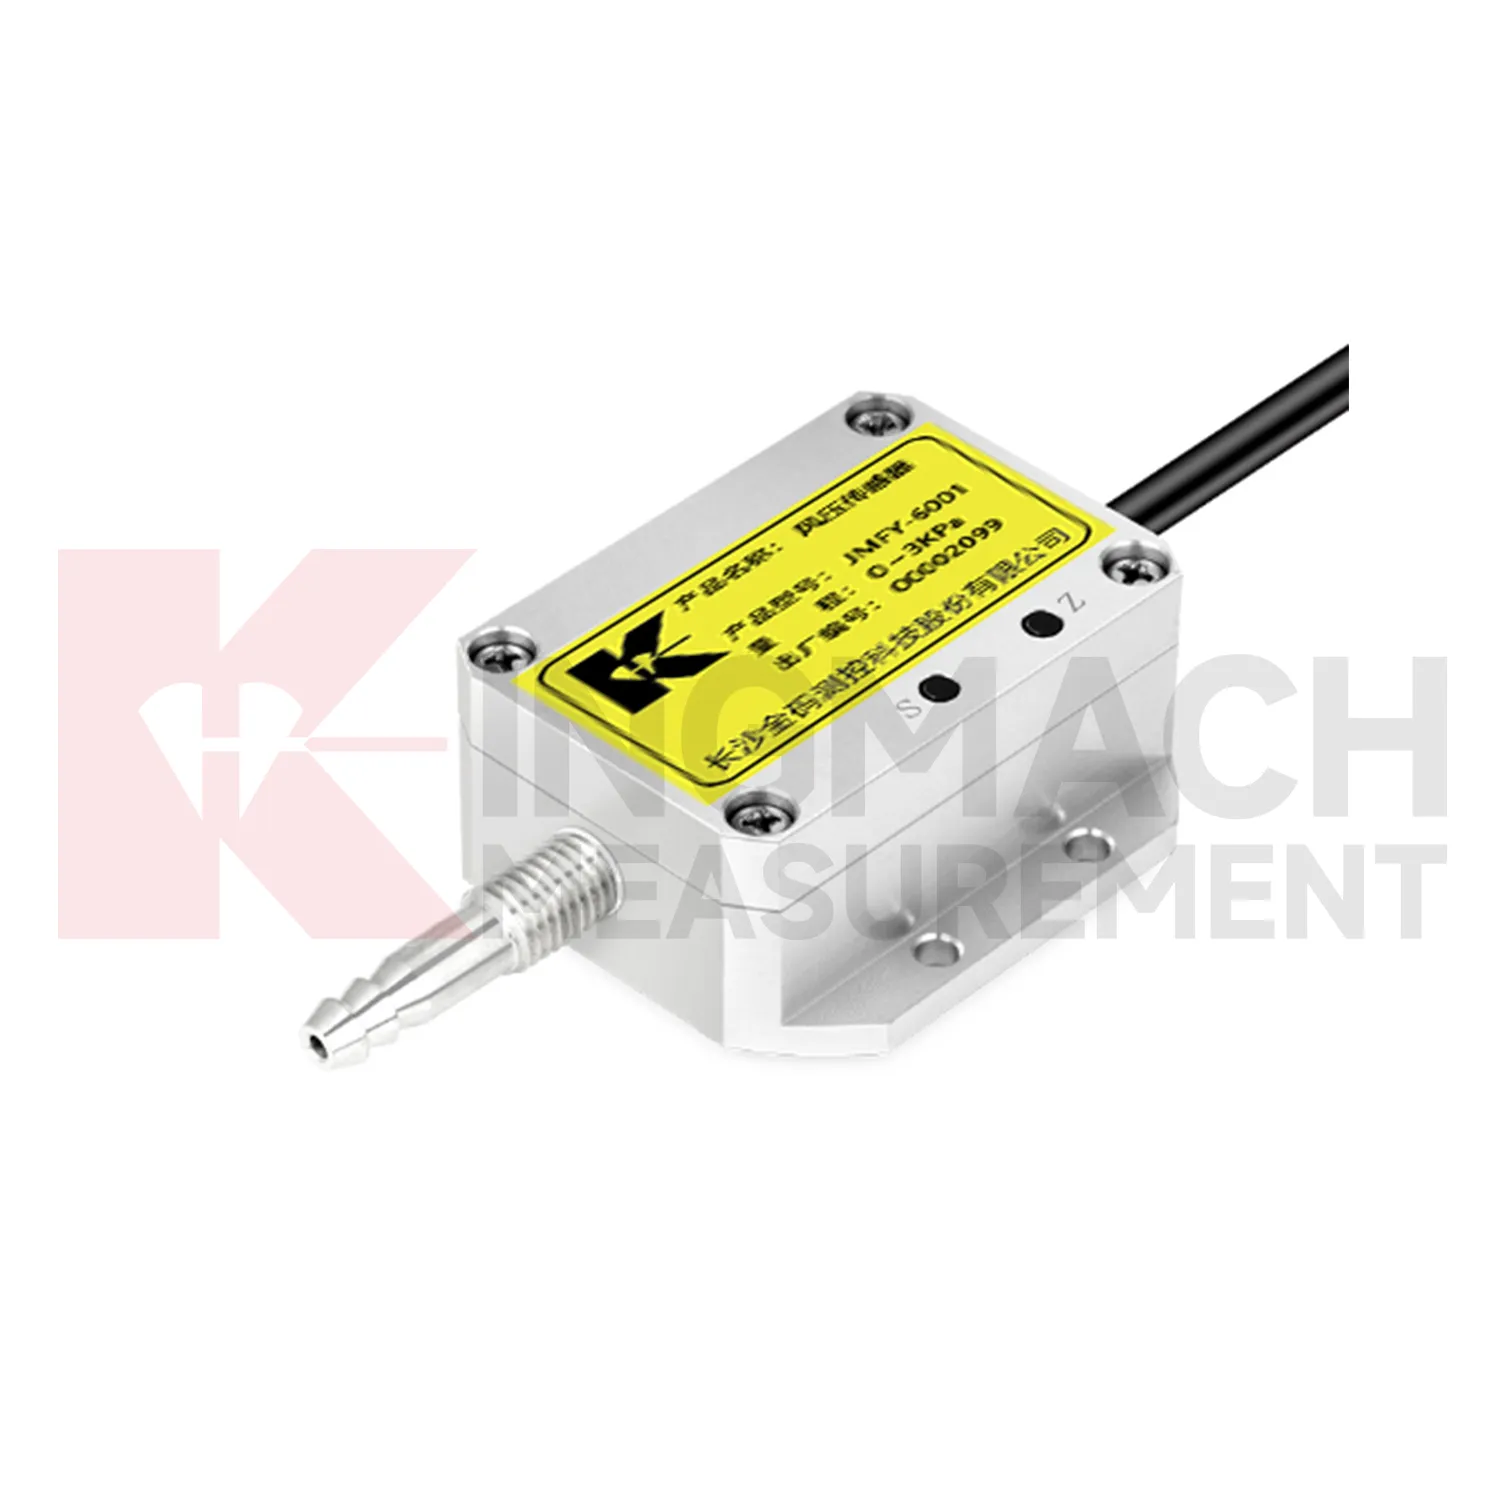
Pressure-channel maintenance for Kingmach tipping rain bucket gauge should keep the pressure path open, clean, and sealed. Tubes, ports, fittings, housings, cables, and power connections should be inspected after storms, dust exposure, washdown, cabinet work, or mechanical impact. Moisture, blockage, loose tubing, or wrong wiring can create readings that look like a pressure event. Pressure data may be reviewed beside wind, airflow, vibration, and structural response, so channel reliability matters. If pressure behavior does not match surrounding conditions, inspect the physical path before assuming the environment changed. A short maintenance note can prevent a long engineering debate later.
During abnormal events, the first question is not only whether the value crossed a limit. The reviewer should ask what changed around the site, whether the related structure reacted, and whether a field inspection confirmed the same pattern.
Long-term value comes from consistency. A channel that keeps the same location, unit, maintenance history, and linked asset record can support seasonal comparison, post-storm review, and handover between construction and operation teams.
Kingmach tipping rain bucket gauge
Rainfall records are a central part of Kingmach tipping rain bucket gauge for slopes, embankments, dams, tunnel portals, and construction sites. Rain does not always cause immediate movement; water may enter the ground, raise pore pressure, soften material, or change runoff over time. That delay is exactly why a dated rainfall record matters. Engineers can compare the storm start, rainfall duration, peak intensity, soil response, and movement curve. Without that record, a slope alarm may be discussed as a vague weather event. With it, the team can see whether movement followed the storm, whether it continued after rain stopped, and whether field inspection is needed. Rain data becomes part of the engineering timeline rather than a background note.
The environmental point should be part of a named monitoring question. It may explain wetting, drying, wind exposure, thermal movement, cabinet stress, or pressure variation, but that purpose needs to be visible in drawings and reports.
If the reading seems unusual, the team should check the physical condition of the station before drawing conclusions about the asset. Blockage, poor exposure, loose wiring, water entry, and changed surroundings can all create misleading patterns.
FAQ
Q: Can environmental data support asset management?
A: Yes. Long-term records help owners compare weather, exposure, maintenance events, and structural response across seasons and assets.
Q: How does it help during alarms?
A: It lets reviewers check whether a structural alarm followed rain, wind, temperature change, humidity rise, or another site condition.
Q: What should dashboards show?
A: Dashboards should link environmental channels to the structural risks they explain, rather than displaying unrelated values together.
Q: Why avoid product-list writing?
A: Readers need to understand monitoring purpose and field value; long product lists make the page harder to use and less natural.
Q: What is the best review habit?
A: Review environmental data with time-aligned structural readings, inspection notes, maintenance records, and the site event that triggered concern.
If the reading seems unusual, the team should check the physical condition of the station before drawing conclusions about the asset. Blockage, poor exposure, loose wiring, water entry, and changed surroundings can all create misleading patterns.
Reviews
Andrew Lee
The visualization software is intuitive and powerful. It helps us analyze monitoring data efficiently.
Matthew Garcia
Instrumentation cables are durable and perform well even in harsh environments. Will definitely order again.
Latest Inquiries
To protect the privacy of our buyers, only public service email domains like Gmail, Yahoo, and MSN will be displayed. Additionally, only a limited portion of the inquiry content will be shown.
Ava***@gmail.comAustralia
Hi, I am looking for reliable tiltmeters and accelerometers for structural health monitoring. Please...
Mia***@gmail.comNetherlands
Dear team, we are interested in your readouts & data loggers compatible with multiple sensors. Do yo...
Related product categories
- resistance of temperature sensor
- Temperature and Humidity Acquisition Module
- water temperature sensor resistance
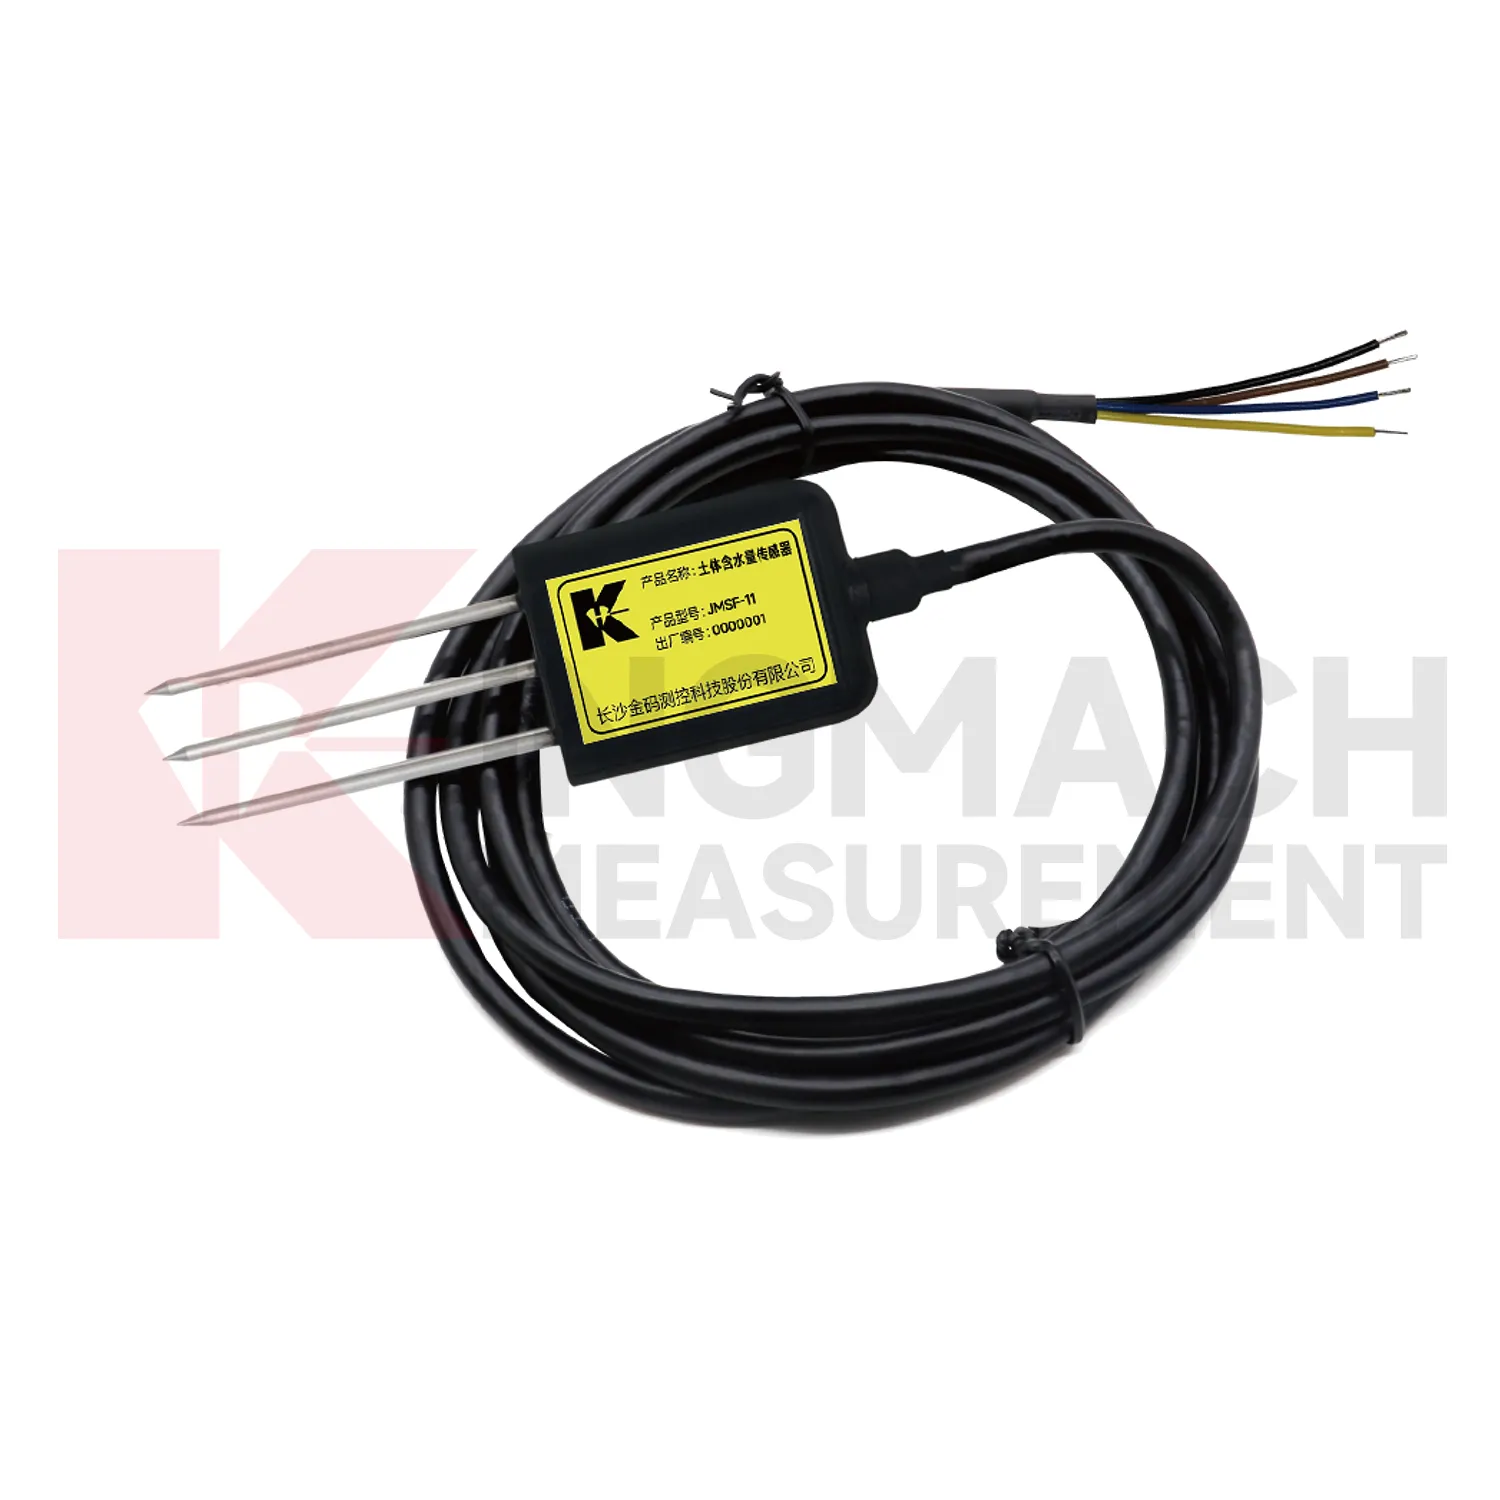
- soil moisture sensor
- soil moisture sensors
- capacitive soil moisture sensor
- best soil moisture sensor
- capacitive soil moisture sensors
- sensor soil moisture
- soil moisture sensor reviews
- capacitive soil moisture sensor v1 2
- resistive soil moisture sensor